
This guide helps you to set Data Graphs up with a sample project, allowing you to start using its search and exploration features immediately.
Setting up your first project
If your account already has an active project, skip this section and go straight to Setting up an additional project. Otherwise read on.
When you first create a Data Graphs account, you will be asked to either create a new project or import a sample.
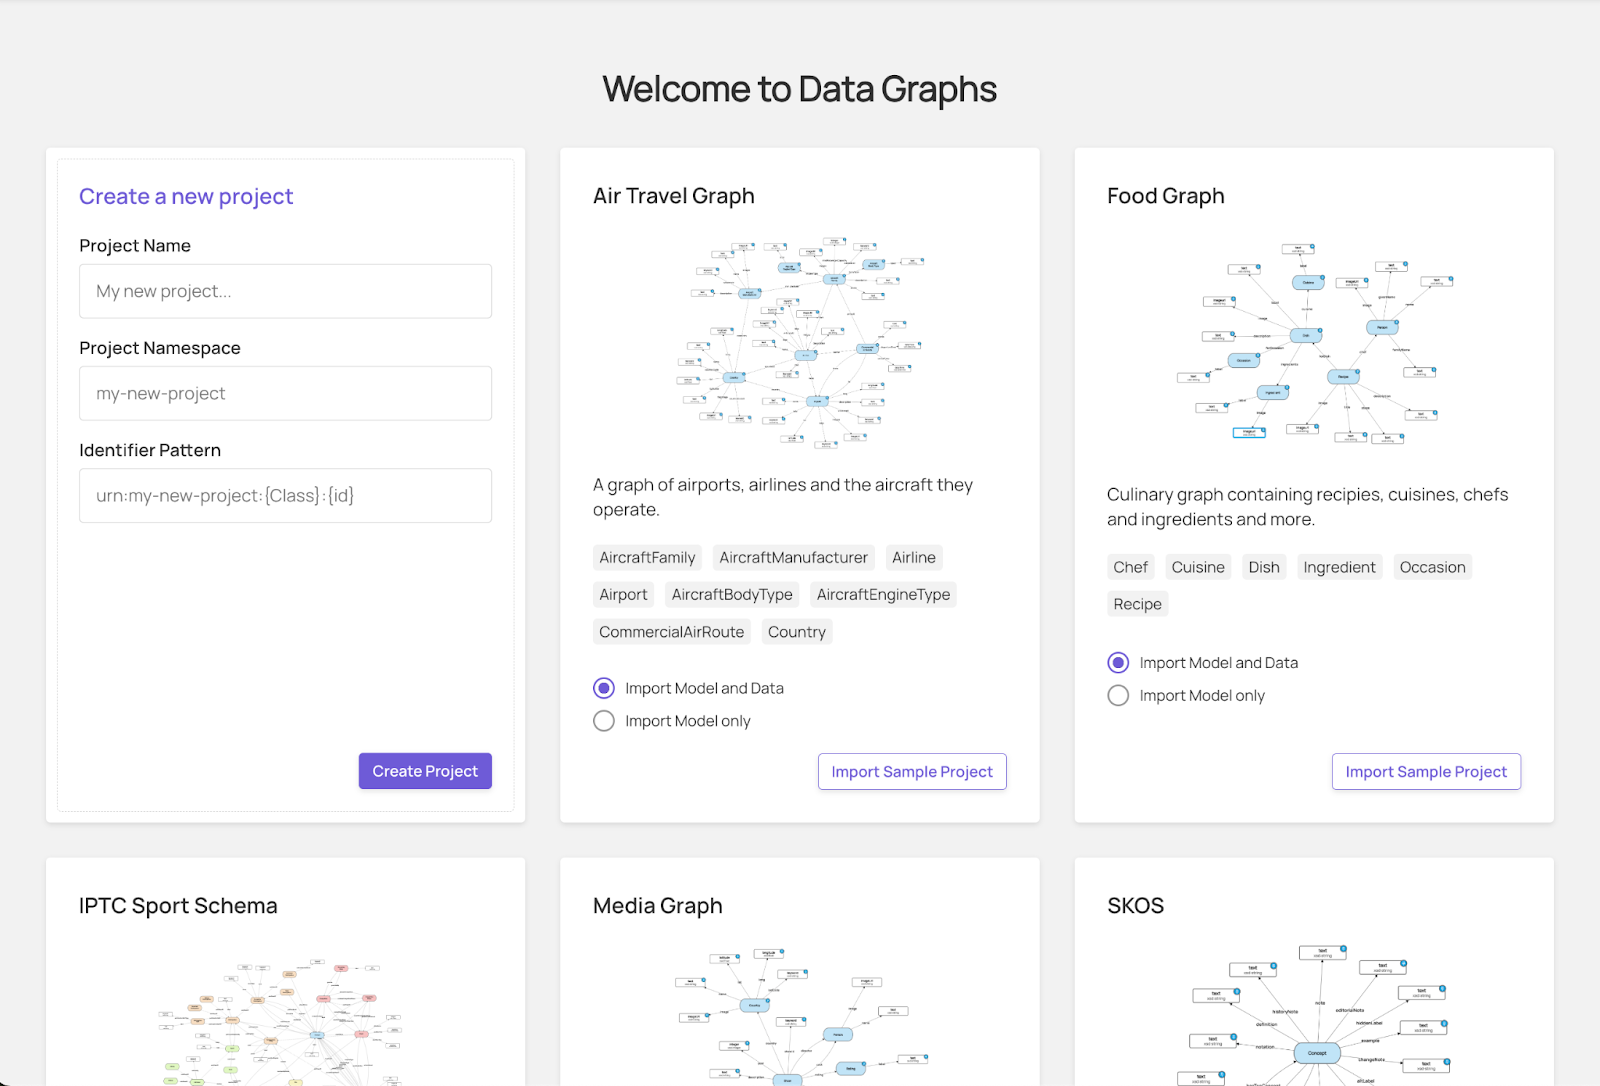
Locate the Media Graph and click Import Sample Project, making sure Import Model and Data is selected.
Once the project is loaded you’ll be taken to the Domain Model builder. For the purposes of this guide you can skip the following section and go straight to The Domain Model.
Setting up an additional project
If the account already has an active project, create another in the account management area:
- Open the app’s main menu by clicking on your avatar in the nav bar
- Select Manage Account
- In the Manage Account panel, select Projects
- Click Add Project
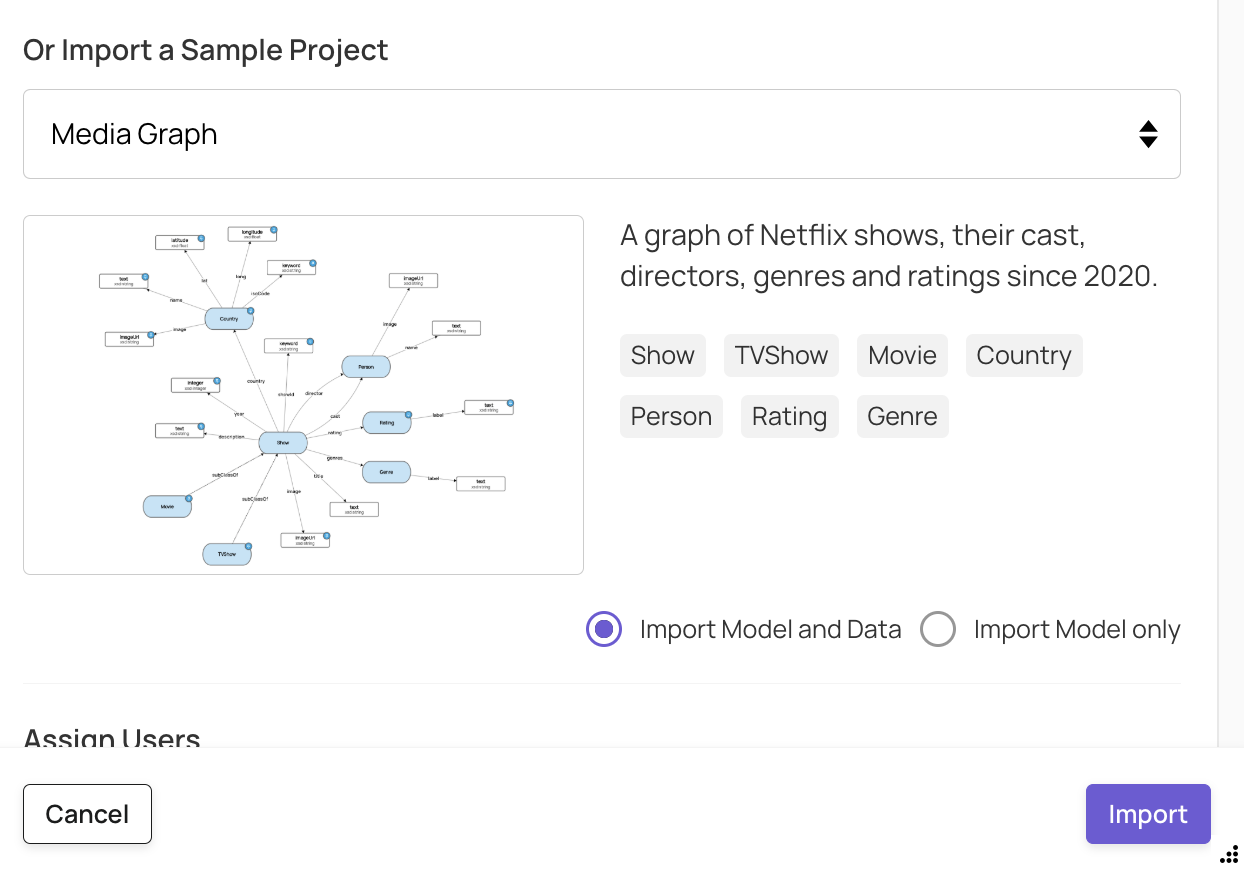
- In the pop-up, select Media Graph
- Click Import, making sure Import Model and Data is selected
Once the project is loaded, open the app’s main menu and select Domain Model.
The Domain Model
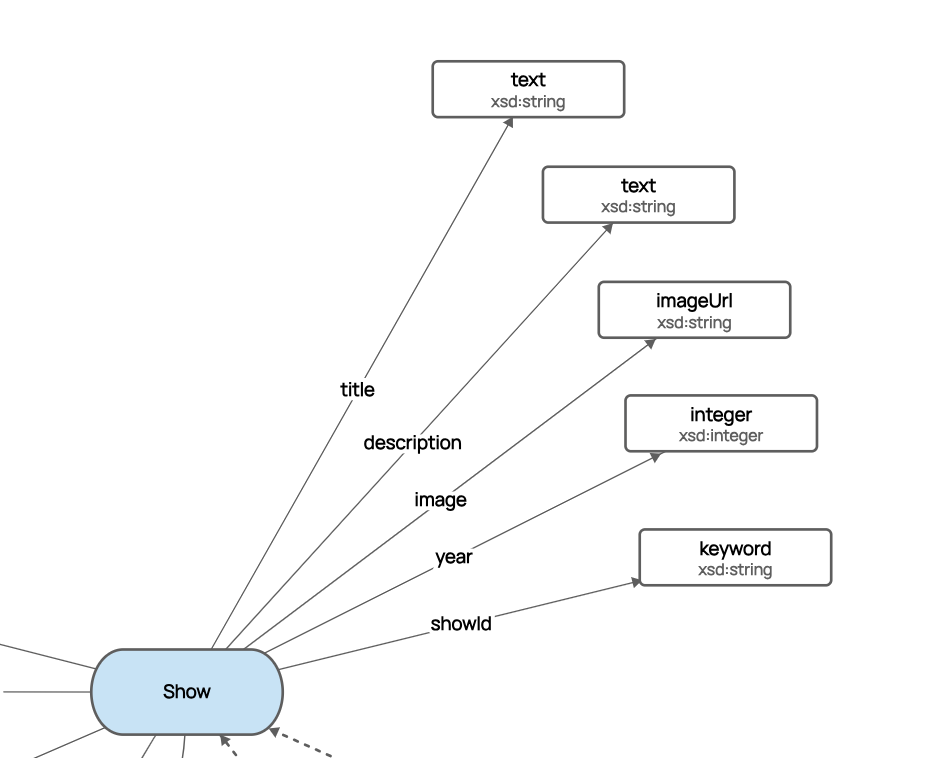
A domain model defines the classes that make up a knowledge graph, their properties, and the relationships between them.
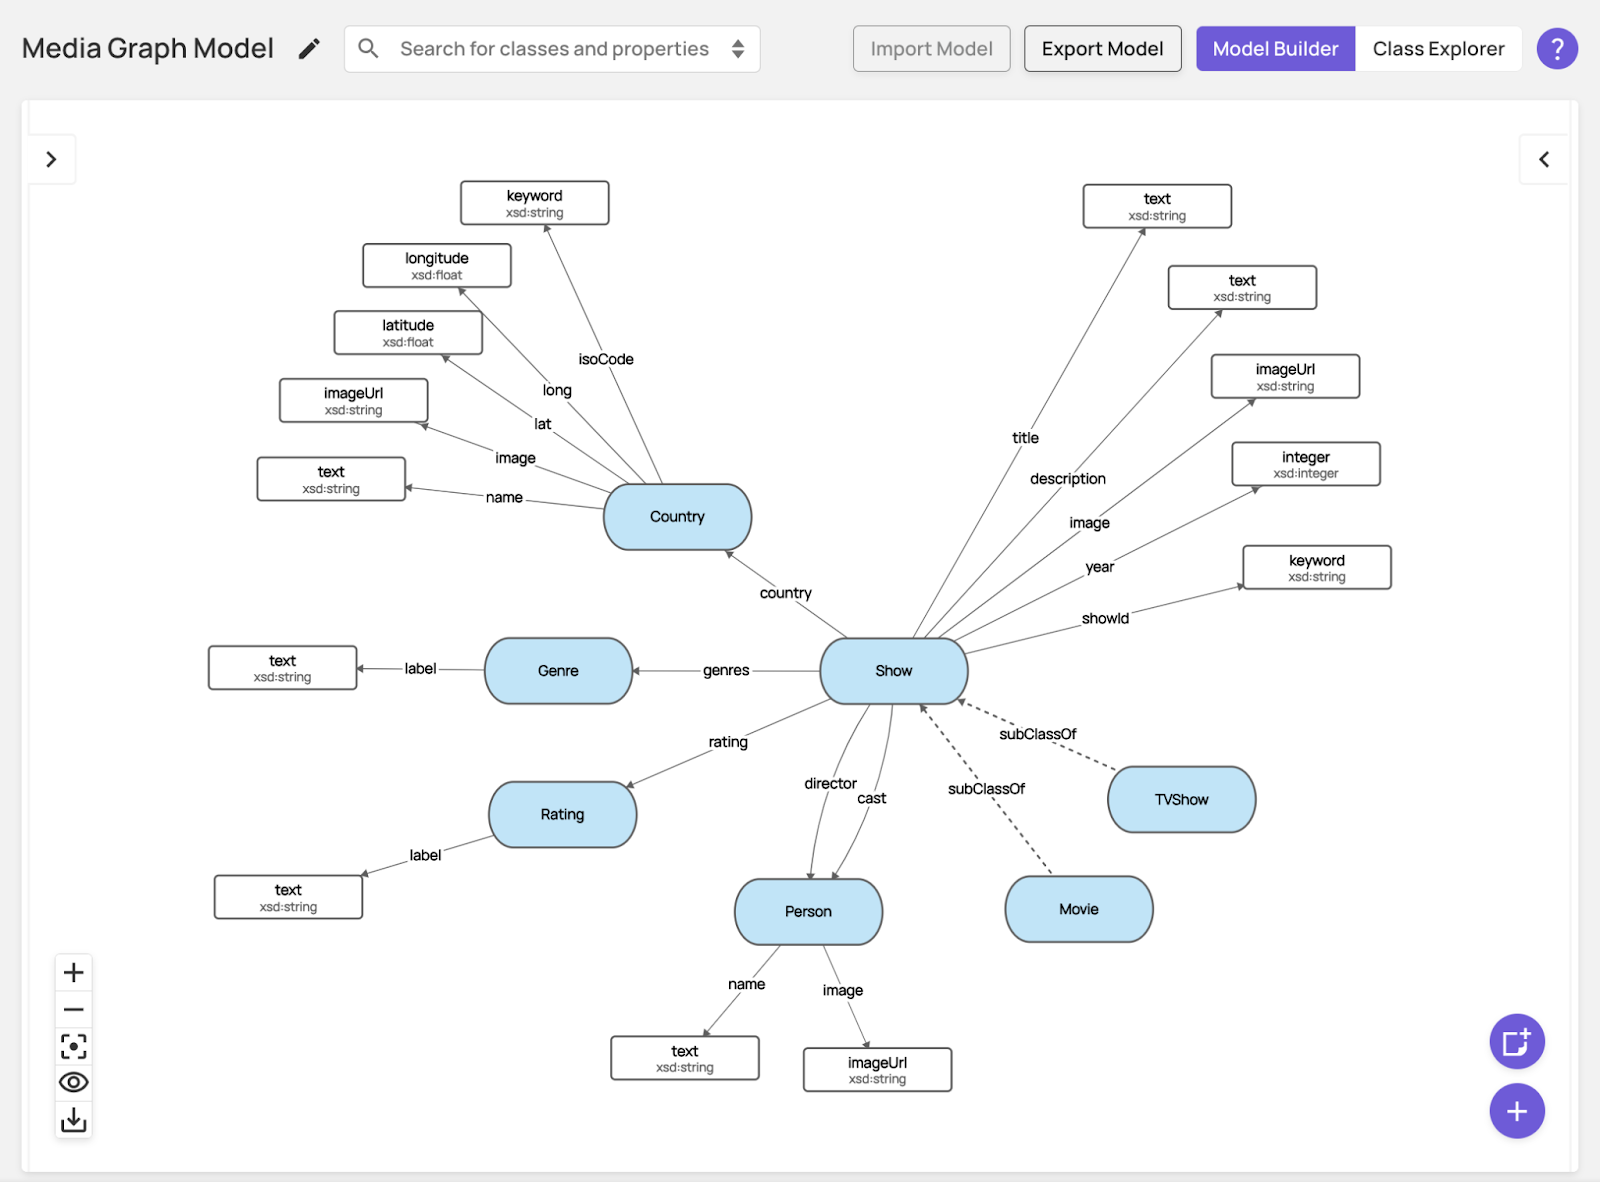
The Media Graph domain model depicts classes as blue ellipses and simple data types as white rectangles. It is based around the classes Movie and TV Show which, via their parent class Show, have relationships with Person, Genre, Country and Rating.
Movie and TV Show are subclasses of Show, which means they inherit its properties. Read more about subclasses.
We won’t be making any changes to the model in this guide. If you want to know more, see Creating a Domain Model.
Datasets and Concepts
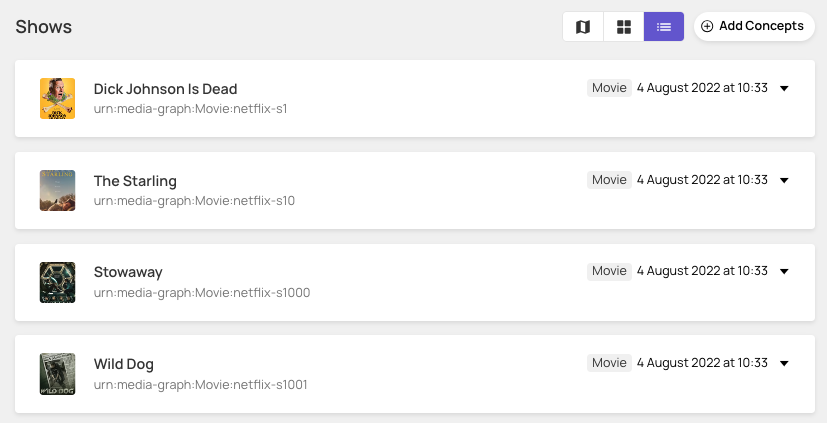
Clicking on the home button at the top-left of the screen will take you to the project’s datasets. These are collections of instance data, or Concepts as they are known in Data Graphs.
In the Media Graph project, each dataset contains Concepts of a certain class or classes, indicated on each tile under Contains.
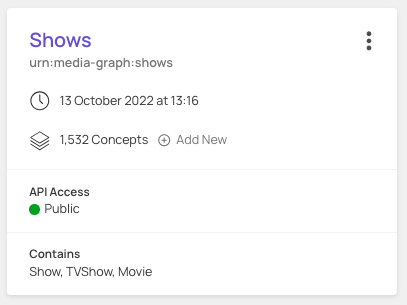
Clicking on the Shows dataset tile allows you to explore its Concepts.
Opening up The Starling (with the down-arrow on the right-hand side) you’ll see all of its populated properties.
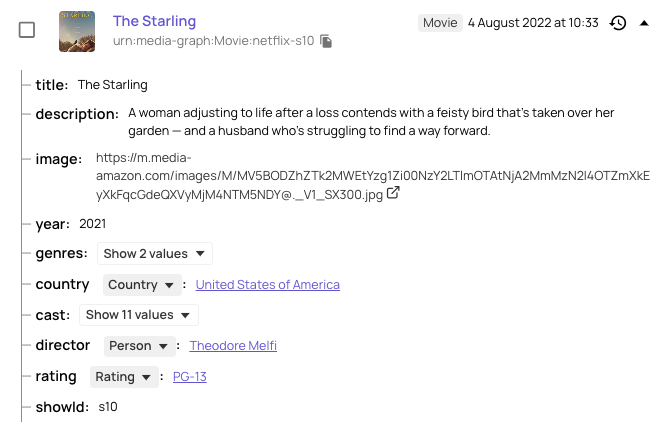
Note the values of some properties like title and description are immediately readable. These are properties with simple data types, depicted in the domain model with white rectangles.
A property with a down arrow next to it indicates that its data type is another class: director, for example, is a Person data type and clicking on the arrow will reveal its makeup. Other properties, eg genres or cast, might have multiple values, indicated by Show n values.
Searching
The left-hand panel allows you to search for and filter the list of concepts displayed in the dataset. Adding a word in the search field reveals a list of Concepts whose text properties include that term.
The search prioritises a match in a Concept’s “label” property. So if you enter dog in the search box, the results show six shows with that term in their title and others where it is used in another field. Hyena, for example, uses it in its description.
In Data Graphs the “label” property is the first property on every Concept. It can be renamed, and on Show it is called title.
Filtering
The headings in the panel underneath the search input indicate that we can use dates, classes and labels to filter results.
Under Class we can choose to show only Concepts of type Movie by selecting the purple tickbox next to Movie. (If we chose the red minus box we would be asking for all Concepts that are not class Movie.)

The selector saying 7 more facets allows us to filter the list of shows using one or more “facets” – properties whose data type allows them to be used for filtering. These can be used in isolation or combined with others.
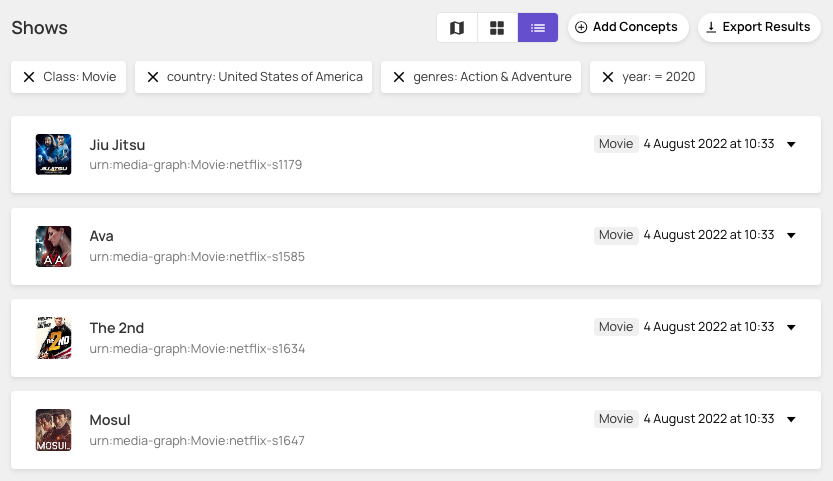
Using the Class, country, genres and year facets, try to find Action & Adventure movies made in the USA in 2020. (Hint: when using a numerical facet you’ll need to type in the value you want to filter on.)
Your should have 20 results, starting with:
Exploring the Graph
Clear all your search criteria (by removing the tiles under Shows) and click on The Starling.
As well as the values of its properties, you will now see options to explore, export, copy, migrate, edit and remove the Concept in the left-hand panel.
Selecting Explore Graph opens a visualisation of The Starling and its relationships to other Concepts, with each node colour-coded according to its class:
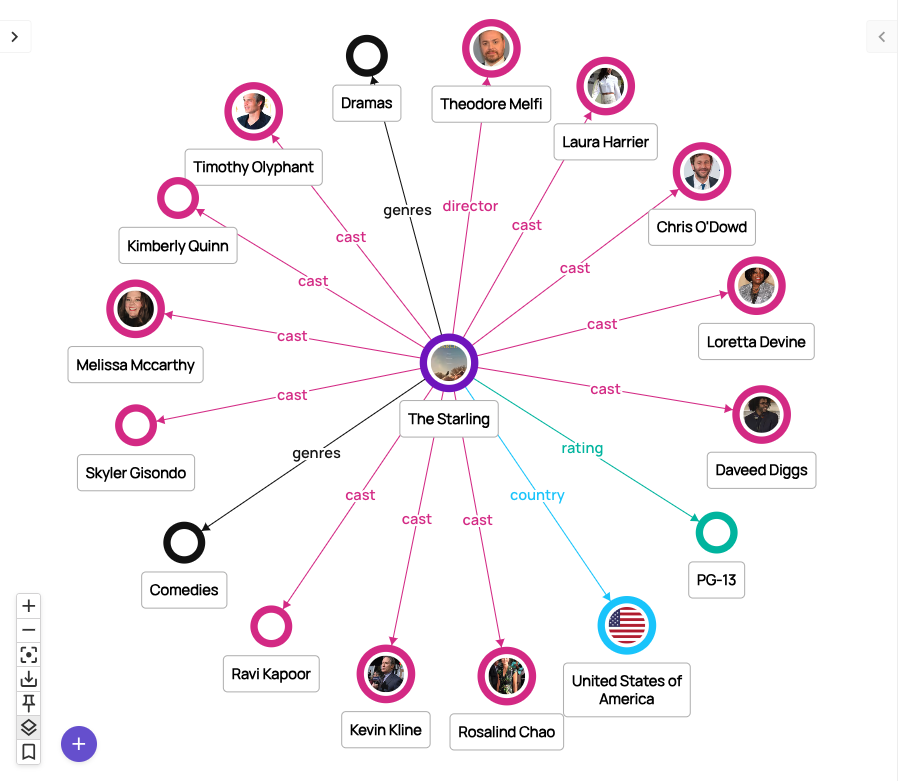
Clicking any node allows you to navigate through your graph from Concept to Concept. Selecting Comedies, for example, reveals 15 other Concepts of that genre, with an option to load more. Clicking on A California Christmas then reveals that movie’s relationships and so on.
At any point you can view a selected Concept in full via the button in the right-hand panel. Note that because you are traversing the graph via relationships, viewing a different Concept from where you started is likely to surface you in a different dataset. So clicking on Melissa McCarthy (a cast member of The Starling) and then View Concept will take you to the People dataset.
